2009 Survey
2009 LibQual+TM Survey Results
Longitudinal Data
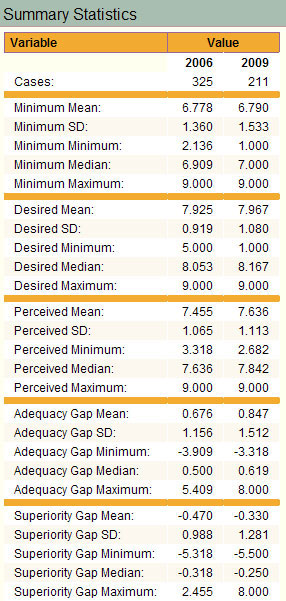
Institutional means
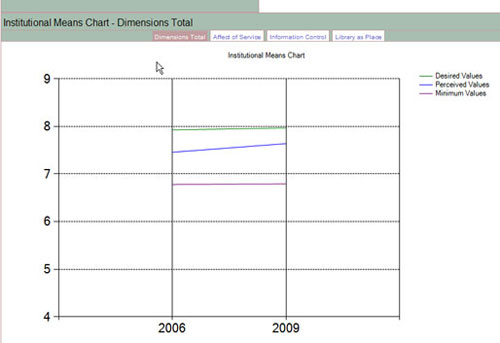
Charting the institutional means from the 2006 and the 2009 administration of LibQUAL+™ reveals trends in user satisfaction. Overall, the minimum level of acceptable service (pink) remained similar while the desired level of service rose slightly (green line). Within this range of service, the perception of the Library (blue line) rose.
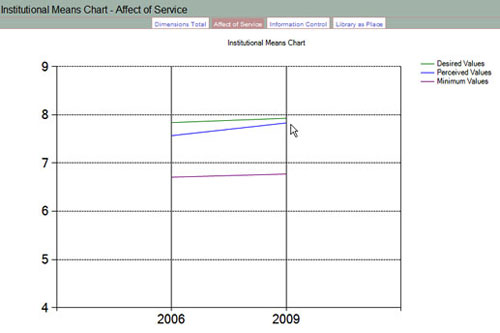
In the dimension of affect of service, minimum and desired levels of service rose slightly. The Library made significant progress in meeting users highest levels of expectation. Comments also indicate a high level of satisfaction with the staff of the Library.
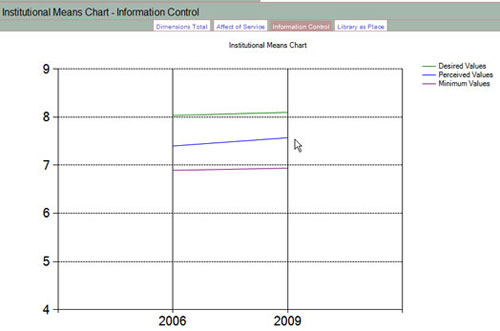
Information Control means indicate a higher level of desired service in 2009 compared to 2006. The perception of access to resources rose in 2009 over 2006.
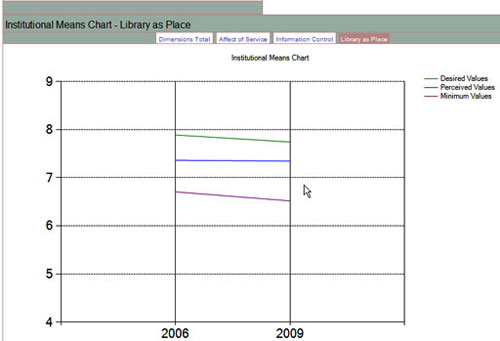
While users expectations for the Library as a place decreased, perceptions of satisfaction remained fairly constant. The most frequently voiced comments in the open ended questions expressed a desire for more group study and quiet study space.
Library Home Page
Contact Us
Staff Directory
The University of Scranton
Weinberg Memorial Library
Linden & Monroe
Scranton, PA 18510
Library Services: 570-941-4000